What issue can we solve for you?
Type in your prompt above or try one of these suggestions
Suggested Prompt

Unlocking the Power of Segmentation Visualization: Best Practices and Tips
The U.K.’s Consumer Duty regulation took effect earlier this summer, requiring banks to maximize their efforts to put their customers’ interests at the center of their practices. Customer segmentation will play a critical role in helping banks understand their customers' needs and preferences and tailor their marketing messages and product offerings accordingly. Many banks, however, still use traditional 1D or 2D segmentation maps and visualizations, which do not fully reflect customers’ complex behaviors and needs.
We examine various segmentation visualization techniques as well as their limitations, exploring the importance of incorporating psychographic data and introducing 3D maps as a more reliable method of customer segmentation. This article is aimed at equipping professionals with the knowledge to take the first steps in better understanding their customers.
What is customer segmentation?
Customer segmentation is the process of dividing a business’s market into subgroups of consumers based on specific behaviors or characteristics. While traditional 1D or 2D segmentation maps, which rely on demographics and basic data, have been widely used by banks, they fall short of capturing the complexity of customer needs and behaviors.
Enhanced segmentation makes it possible for financial institutions to deliver tailored, personalized offerings to their customers and comply with Consumer Duty. Some are even beginning to think bigger and are incorporating AI and ML in their efforts.
Types of customer segmentation: what banks do today
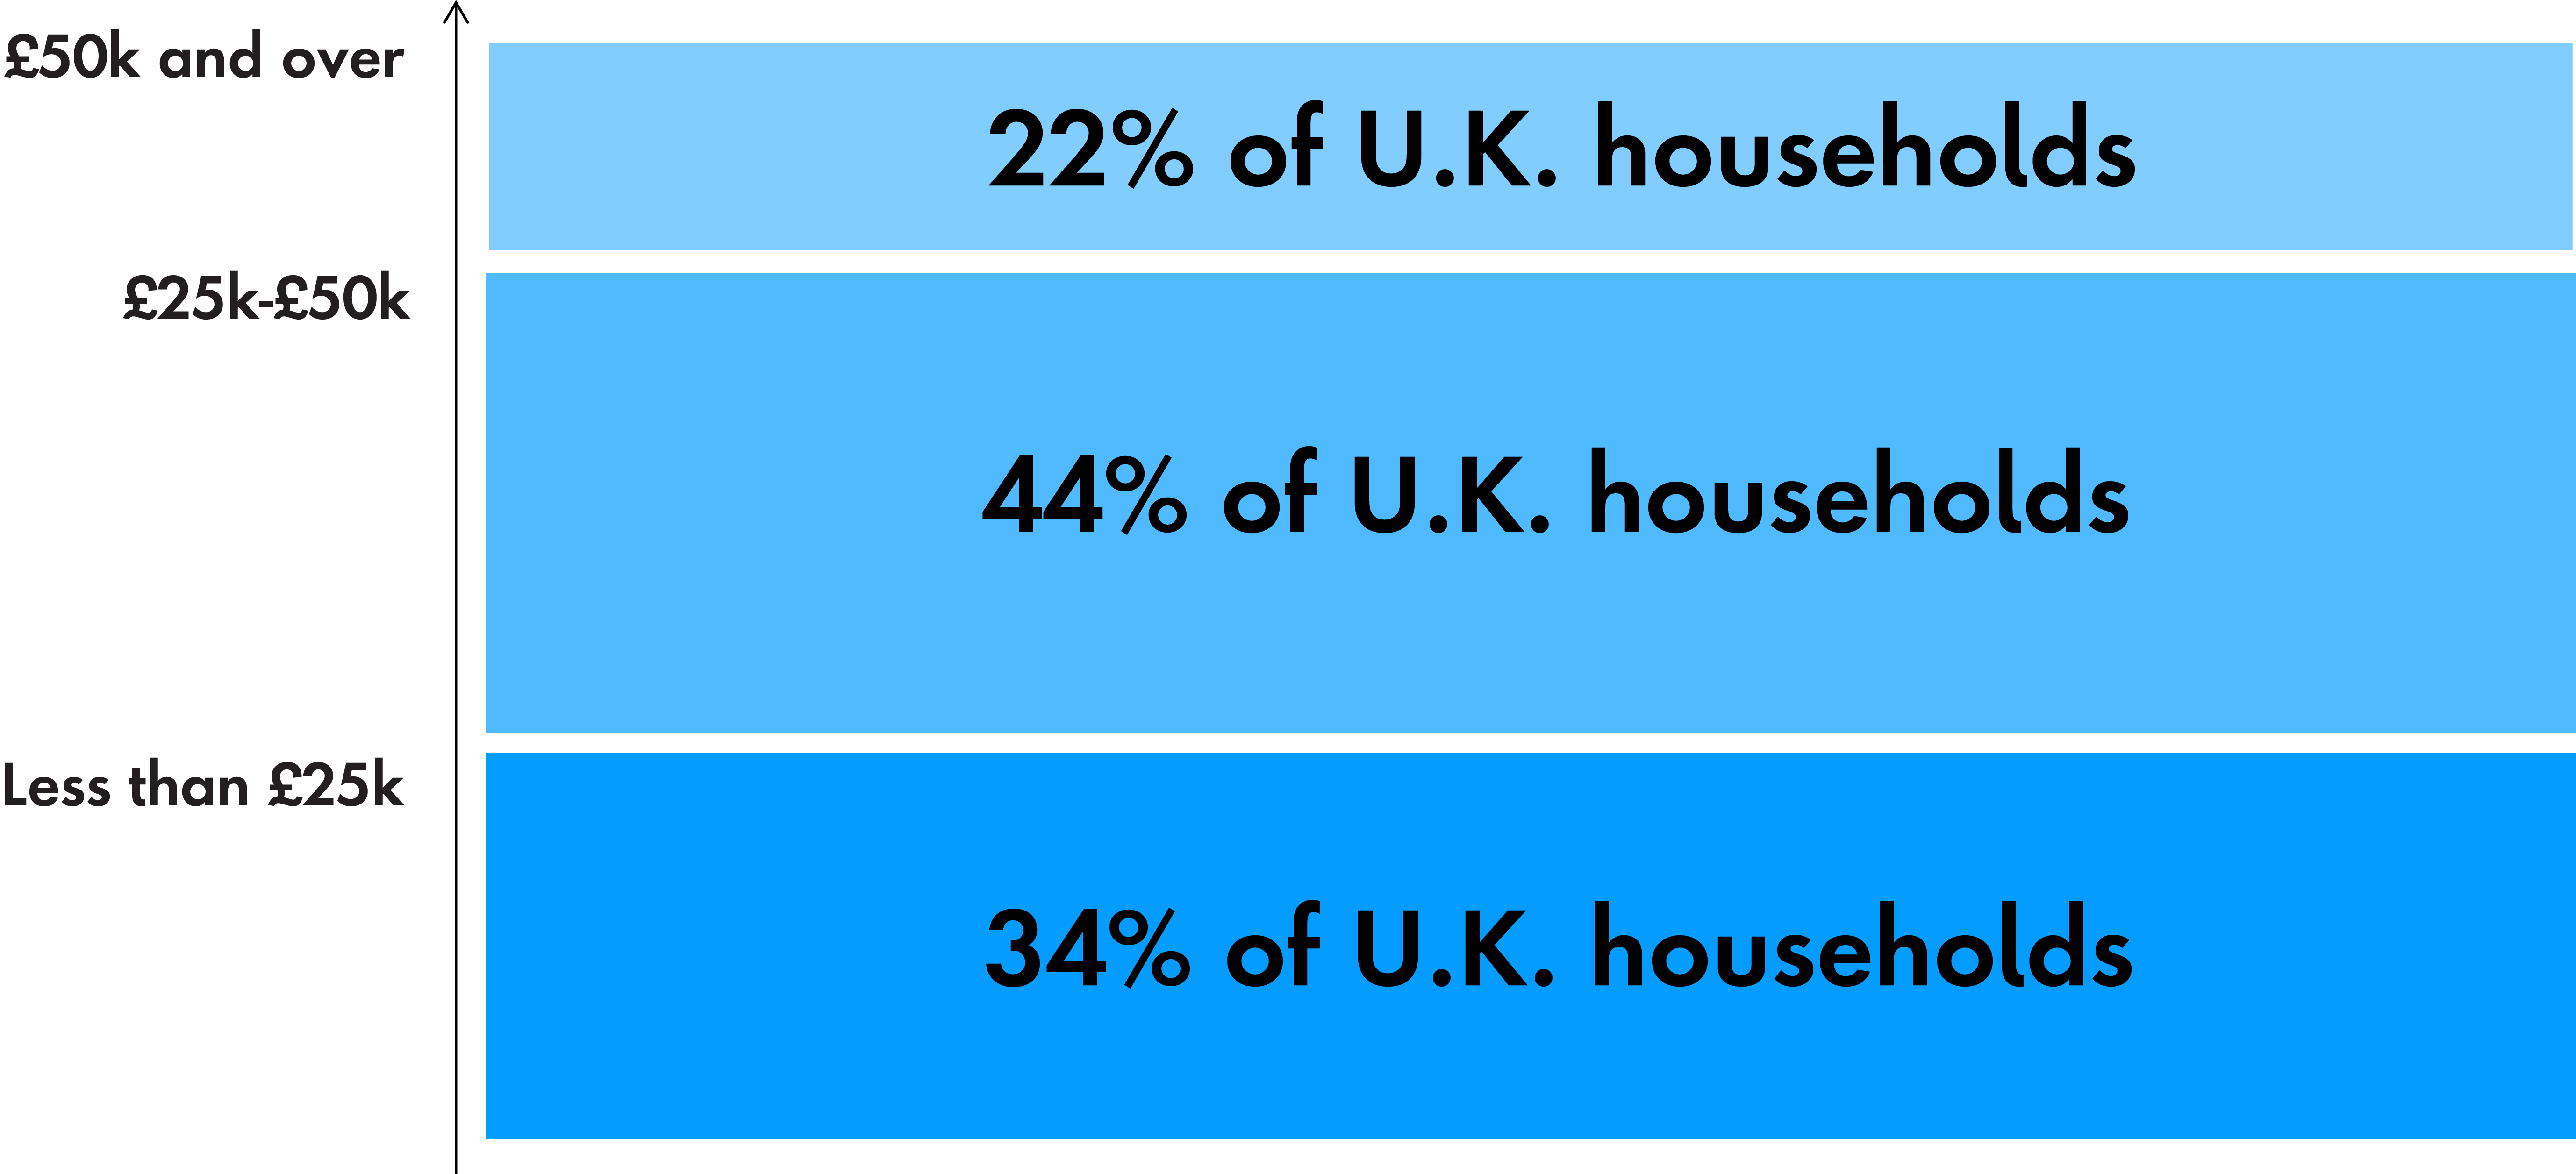
Today, some banks’ departments still rely on 1D segmentation visualizations (or maps) that primarily focus on income or location. Such maps are one of the simplest methods of customer segmentation and are useful for targeting broad customer groups but fail to provide a detailed view of customer behavior and preferences, which is at the core of the regulator’s expectations.
1D customer segmentation maps
-
Let’s consider a simplified hypothetical example. A bank wants to launch a new banking channel—voice assistants (V.A.s). They are keen to provide the best CX for the right audience.
Currently, the way they segment their audience is shown in Figure 1.
Based solely on this information, it will be difficult for management to make a decision. On the one hand, customers in the highest HH income bracket may be more likely to already own a voice assistant device; however, the middle bracket represents the largest opportunity pool.
For instance, wealth managers often use 1D segmentation to target customers based on affluence level, such as high-net-worth vs. ultra-high-net-worth individuals. However, this approach overlooks the fact that customers within the same income range can have varying financial needs and preferences influenced by factors like values, source of income, or life stage.
Consumer Duty regulations emphasize the significance of customer-centricity and the need for a comprehensive understanding of customers. Depending solely on 1D segmentation maps may hinder compliance with these regulations and limit the ability to effectively address customer needs. A holistic approach that goes beyond a single dimension is vital for meeting the requirements of Consumer Duty and delivering tailored offerings that align with customer interests.
2D customer segmentation maps
2D segmentation maps are slightly more advanced than 1D maps as they incorporate two-dimensional data such as income and location or age and gender. More sophisticated 2D maps plot demographic data against affinity to product scores (vs. another demographic variable) to enhance their engagement and acquisition efforts.
-
If we continue the example, let’s now imagine the same bank decided to add another dimension to their data—generation.
Generational differences encompass a variety of attitudinal, societal and cultural differences between cohorts, which can be useful in decision-making.
Yet, based on this 2D segmentation map, one may conclude that even though younger cohorts, which are naturally more digitally-savvy and used to the technology, may be too narrow a target to pursue. The older cohorts, despite representing a larger section of the population, may face more adoption barriers. So, perhaps the opportunity lies in targeting Gen X in the upper HH income brackets and any halo they may attract.
Using two dimensions to understand customers’ behavior and uptake has proven to be a great strategic tool—it is simple and convenient to navigate. For instance, splitting the market by age and digital savviness has been a useful strategy for technology companies. This approach helps identify customer segments with different levels of technological adoption and tailor marketing messages and product offerings accordingly. It provides a simple and convenient way to navigate the market and target specific customer groups effectively.
In the context of Consumer Duty, however, the regulator is looking for an even more comprehensive view, enabling personalized product offerings, and considering key factors, which affect the consumers’ ability to make choices, including accessibility needs, vulnerability factors and personal circumstances.
Considering other elements such as the customer's interests, values or personality traits on top of the two dimensions already in place would not only enhance customer engagement and loyalty but stand a better chance of adhering to the regulatory requirements.
For example, a bank might want to explore launching products targeting customers who are more environmentally conscious and value sustainable banking practices. In such cases, psychographic data (the study of personality, values, attitudes, interests and lifestyle characteristics of a person or group) can be collected on top of existing demographic data by:
- Asking consumers via surveys about their environmental values and behaviors
- Analyzing social media posts and engagement related to sustainability
- Conducting customer interviews or focus groups exploring motivations and preferences
As you can see, while utilizing a 2D segmentation approach has proven beneficial for companies in understanding customer behavior, it is important to recognize that the accompanying 2D visualization may not capture the full complexity of customer preferences. By incorporating a third dimension, such as in the example above, companies can uncover deeper insights and enhance their ability to personalize marketing messages and product offerings, ultimately driving better customer engagement and satisfaction.
3D segmentation maps
3D segmentation maps are a more advanced method of segmentation visualization that incorporates numerous data variables, including demographics, transaction history and psychographics. Data scientists utilize clustering algorithms to group customers based on shared characteristics and behaviors, resulting in the creation of a segmentation model. This model provides a more detailed understanding of customer preferences, enabling banks to deliver improved and personalized customer experiences.
But how are they better than 1D or 2D maps?
Compared to traditional 1D or 2D segmentation maps, 3D cluster maps offer several advantages. They provide a more granular view of customer behavior and preferences, allowing for more precise targeting and personalized marketing efforts, which can lead to better customer engagement and loyalty. However, cluster maps can be complex and difficult to interpret for non-data scientists, limiting their usability.
A simpler diagram that combines the strengths of 1D, 2D and 3D cluster maps could be a more effective way to visualize a segmentation map, providing a clear and comprehensible representation of customer segments while capturing the benefits of each approach.
-
By adding a third layer of information and ultimately creating a 3D segmentation map, the team can now make more informed decisions.
Despite the 1D map identifying the upper two HH income cohorts as desirable, and the 2D map strongly supporting the targeting of Gen Xers—when overlayed with propensity data, the 3D map now tells a different and much more complex story.
There are, of course, a number of other data points needed to make such a decision, including qualitative data and customer lifetime value (CLV). However, even this simplified example shows how 3D maps could be an asset in decision-making.
Here, we can see that, for instance, the two most opposing generations perhaps share the most similarities in voice-assistant usage and propensity in two of the HH brackets. Developing a product that meets both of their needs would be challenging, but the advantage here is that the strategy cycle is now much more narrowed and focused.
Figure 3 provides the space to combine customer-oriented and produced classifications with segments defined through a business lens. Using a top-down slicing approach along with a bottom-up statistical clustering, this simplified “3D” map visualizes customer groups more accurately and comprehensively than a 1D or 2D map and in a more digestible way than a traditional 3D cluster map.
A simplified “3D” map could be better suited to adhere to Consumer Duty by providing a more comprehensive understanding of customer behavior and needs. By incorporating multiple dimensions of data—such as demographics, transaction history and psychographics—and presenting in a manner that helps humans conceptualize, it surfaces and reveals a deeper level of customer insight. This understanding can allow banks to tailor their product messaging and offerings in a way that aligns with the interests, needs and preferences of their customers.
The simplified “3D” map acts as a powerful first-line defense tool to identify and address potential gaps in meeting consumer requirements, ultimately supporting the goal of putting customer interests at the center of banking practices. Naturally, employing further analysis drilling into each segment and further enhancing the bank’s capability to “understand” each customer individually will be the next best step. However, with limited resources and capabilities a simplified “3D” map could be a great first step.
The pros and cons of different types of customer segmentation mapping
How banks can begin to incorporate 3D segmentation mapping
Many banks fail to validate their customer segments using multiple data sources. If banks don’t continually evolve their customer segments, they risk creating marketing strategies and product offerings that don’t resonate with their target audience.
So, how can banks take the first step toward better customer segmentation mapping?
1. Validate customer segments
To ensure that their customer segments accurately reflect customer behavior and preferences, banks should use multiple data sources to validate their segments. This can include transaction history, customer feedback or even social media data.
A bank might assume that a certain customer segment is interested in a specific type of product based on their segmentation mapping. However, if the bank does not close the loop on this assumption with additional data sources, such as actual transaction history or customer feedback, they may end up investing in a product that does not meet the needs or preferences of their target customers and/or ends up being a square peg forced to fit into a round hole.
2. Solution: incorporate psychographic data
This type of data provides a more complete view of customer behavior and preferences and can help banks develop more personalized experiences and product offerings. Examples of psychographic data that banks might use in customer segmentation could include:
- Values and beliefs (e.g., environmentally conscious, socially responsible)
- Personality traits (e.g., risk aversion, openness to new experiences)
- Interests and hobbies (e.g., travel, sports)
- Lifestyle characteristics (e.g., preference for urban or rural living, family size)
- Propensity to use a channel (e.g., digital vs. branch)
3. Humanize the data
When compiling analytics to understand who your customer base may be, it can be easy to lose sight of the customer’s goal in interacting with your service or product. Consider these questions:
- How does the customer perceive the world and how it works?
- What is the customer’s motivation for interacting with this product/service?
- What is the customer trying to achieve and what is their reason for investing in this product/service?
- How does the target audience hope to interact and engage with you when inquiring about this product/service? Further, how do they hope to come into contact with your service?
4. Improve the accuracy and effectiveness of segmentation mapping
When beginning to incorporate 3D segmentation mapping, banks should focus on:
- Incorporating additional data sources, such as social media data, analytics, customer support center data, Voice of the Customer (VoC) and customer feedback
- Folding in coded, qualitative insights gathered from continuous discovery or ad hoc projects that bring the customers into contact with the company through product, design, insight or marketing BAU
- Using machine learning algorithms to identify patterns and trends in customer behavior and preferences
- Validating customer segments using multiple data sources
5. Visualize a 3D map
Some of the best 3D maps often fail in the boardroom because they don’t convey a story in an easily digestible manner for all—from board to CEO and CTO, all the way to those on the front line, such as customer service agents.
Show don’t tell
As humans, we establish a better understanding of concepts if they can be illustrated and demonstrated. While a cluster map can be complicated, it can act as visual proof of its own conclusions while helping people understand the journey to those conclusions if they engage with it.

Transparency within the data set
Customer data is not objective by default. Meaning is imbued into the data through its analysis. This is why transparency and bias mitigation is needed at each step. A cluster map helps build trust with stakeholders through this transparency and empowers them to make decisions by acting as a single source of truth.
Contextualizing for future growth
Continuous discovery is important. Customers evolve. Competitors evolve. Products and services evolve. The context within which we all operate is constantly evolving. Clearly visualizing what data went into a cluster map helps teams understand if the result is relevant or needs updating. Has customer work-from-home data been considered? And is it current and up-to-date? Which clusters consider sustainability to be important, and does its inclusion impact final results?
Understanding scale and effect
What is important? Who is it important to? And how much does that impact their decision-making? Mirroring the results of a ground-up analysis method, the cluster map can surface, at a glance, what is most important for each segment and should have the greatest impact, as well as what to avoid completely.
Improving communication between teams
By combining different sources of data, a cluster is in the most advantageous position to act as a single source of truth. It helps teams speak the same language and reach an operational consensus to shape and define future work. This also means that, as a service improves, the evidence of any improvement is transparent and obvious to everyone who uses the map as a shared, centralized point of evidence.
Digital transformation through 3D segmentation is the future for banks
In summary, to enhance their customer segmentation practices in alignment with Consumer Duty, banks should prioritize the incorporation of multiple data sources into their segmentation analysis. By doing this, banks can ensure a more accurate understanding of their customers' behavior and preferences. Furthermore, the adoption of simplified 3D segmentation maps can enable banks to better tailor product offerings to each customer segment and ensure fair treatment for each, thus better meeting the expectations set by Consumer Duty regulations.
Publicis Sapient has helped implement data-driven CX solutions for numerous financial services clients, helping them to improve their offerings for specific segments. Our expertise and knowledge in this space have allowed us to develop our own Customer Experience Growth Index (CXGX). CX metrics traditionally used by organizations measure customer experience but don’t operate as an indicator of future performance. So, it’s impossible to tell which investments in CX will be most effective.

CXGX: The Customer Experience Growth Index
Check out our CXGX report to learn how you can improve the overall CXGX score of your bank.
Related Reading
-
How banks customer experience can support low income households
Don’t leave your lower-income customers behind – start developing smart, customer centric products and services that can help them better manage their finances during the cost of living crisis.
-
Why Customer Journey Transformation in Financial Services Doesn’t Always Deliver on Its Promise
Successfully scale your organization’s customer transformation journey program by following these three fundamental drivers in Financial Services.
-
Anticipating Growth
How big banks can create individualized experiences that directly impact their top line.